Monday, November 1, 2010

Rails3: Migrating from MySQL to PostgreSQL

I encountered an error even though I had successfully run:
gem install pg
I googled:
install postgresql rails windows "no such file to load -- pg"
and Peter Mac helped me out. In your Rails 3 Gemfile, make the following change:
#  gem 'mysql'
gem 'pg', :require => 'pg'

Thursday, August 19, 2010

California Academy of Sciences, Golden Gate Park, San Francisco

Yesterday, I finally had the chance to visit the California Academy of Sciences, motivated by my desire to see the Living Roof. They say if you live near a landmark, you tend to not make an effort to see it, and I believe that's what happened with me. Luckily, a friend from Belgium was in town, and I had the idea to show him and his wife the facility; unfortunately, plans fell through, but I decided to go alone. Every third Wednesday is Free Day. My advice: get in line as early as you can. I got in line at 8:40am, and the line was already fairly long. Doors open at 9:30am, and close at 5pm. By the time I left, at 2:45pm. the line was still extremely long, and people at the front had been waiting for 50 minutes.

http://www.calacademy.org/visit/

Photos are courtesy of SharpShooters.


18AUG2010WED  9;45am_entrance_California Academy of Sciences
Outside the entrance, doing my best scuba diver impression

18AUG2010WED 10am_Extreme Mammals_California Academy of Sciences
Outside the "Extreme Mammals" exhibit, doing my best wooly mammoth impression (we're all showing our teeth)

Tuesday, June 22, 2010

Are you a sociopath, or just an extreme narcissist ?

Jenna meets a paramedic. He thinks she's incredible, and they seem perfect for each other. He leaves before they can plan to meet later, and now, at her wit's end, Jenna tells her coworker Pete the story. This reminds Pete of a book he once read, a question psychiatrists ask in order to ascertain whether a person is a sociopath:


Recently, a friend recommended a book, The Sociopath Next Door, which he says will keep you up at night, thinking how 1 out of every 25 people you meet would just as soon kill you as tell you to get out of the way. A fellow 30 Rock fan said on his blog:
...the basic principle of sociopaths viewing others as tools instead of people is entirely correct. Sociopathy is more than just a lack of emotion, they literally don’t connect to people the way human beings are supposed to.
Reference: http://www.fearfulsymmetry.net/?p=179

All this talk of sociopathy (psychopathy is the outdated term) makes me wonder whether sociopath is the latest incarnation of witch, Communist, racist, or even terrorist. Who in their right mind, when accused of such a despicable thing, even labeled as such by an expert or authority, can figure out what to do or say to disprove it ?

Friday, June 11, 2010

Neon Signs on Korean Storefront from Nabbeun namja (2001)

After the Bad Guy gets beat up by the soldiers, he sees the girl's boyfriend meet up with the girl, and the Bad Guy covertly follows them around on their date. Towards the end of the evening, the boyfriend tries to lead the girl to a Korean storefront, but she hesitates, then refuses, and kicks her boyfriend in the leg before running off. The Korean storefront had neon signs in front. What do the neon signs say ?

Korean storefront still from 2001 movie Nabbeun namja, Bad Guy

**UPDATE**
This question has been answered by sonofberzerk on imdb:

It says "motel."
It's a love motel.
They're all over Seoul for couples who want to have sex, but can't get privacy at home because of living with parents or they're having affairs or something like that.

http://www.imdb.com/title/tt0307213/board/nest/164747758

Sunday, March 21, 2010

In Memoriam: Alicia Scott Lee, 17, of Mill Valley, California

My heart goes out to Alicia's family. The photograph being referred to in the last sentence of the article is here:

Alicia Scott Lee at Crissy Field
[Alicia] was the subject of a published photograph herself recently, when a Chronicle photographer captured her examining a puddle at Crissy Field after a rainstorm in January.

The photo, which she adopted as her Facebook profile picture, shows her traipsing ankle-deep through the water, studying the ripples, camera around her neck.
Reference:
http://www.sfgate.com/cgi-bin/article.cgi?f=/c/a/2010/03/21/MNB41CJAEO.DTL&tsp=1

Monday, December 21, 2009

The Influence of the Stars

Right around the time I found out Brittany Murphy died yesterday, I finished reading Eating Animals by Jonathan Safran Foer. In an eye-opening piece on the 1918 Spanish flu pandemic (which killed more humans faster than any other disease, or any other anything, has before or since), the author goes into the history behind the word 'influenza':
Much like the virus it names, the word influenza comes to us by way of a mutation. The word itself was first used in Italian and originally referred to the influence of the stars - that is, astral or occult influences that would have been felt by many people at once. By the 16th century, though, the word has begun mixing and blending with the meanings of other words and come to refer to epidemic and pandemic flues that simultaneously strike multiple communities (as if the result of some malevolent will).
Reference: page 13 in Eating Animals.

Much like an Italian villager in the 1500s, I feel like the universe is conspiring against me, trying to prevent me from discovering more about three Asian American actresses in a movie with Brittany. I searched IMDB, on Google, and even posted a question on Yahoo Answers, all to no avail. So I ask you, Gentle Reader, what are the names of the actresses who portrayed Janet Hong and 2 other unnamed Asian female characters in the movie Clueless (1995) ?

Wednesday, September 23, 2009

how to import data into R and SAS

What is bio-statistics and how does it relate to me ? I am often asked this question, and now I think I may have an answer. With the advent of the Internet, we are now in the Age of Information, and when it comes to "statistical data analysis", a rather imposing mouthful, to quote a recent article in the New York Times (and I paraphrase):
In field after field, computing and the Web are creating new realms of data to explore - sensor signals, surveillance tapes, social network chatter, public records and more. We're rapidly entering a world where everything can be monitored and measured, but the big problem is going to be the ability of humans to use, analyze and make sense of the data. Strong correlations of data do not necessarily prove a cause-and-effect link. For example, in the late 1940s, before there was a polio vaccine, public health experts in America noted that polio cases increased in step with the consumption of ice cream and soft drinks. Eliminating such treats was even recommended as part of an anti-polio diet. It turned out that polio outbreaks were most common in the hot months of summer, when people naturally ate more ice cream, showing only an association. Computers do what they are good at, which is trawling these massive data sets for something that is mathematically odd, and humans do what they are good at and explain these anomalies.
To analyze statistical data, we use computer programs as tools to work with such information as biological data. Yet another recent article in the New York Times compares and contrasts two of these computer programs, R and SAS (and again I paraphrase):
SAS Institute (the privately held business software company that specializes in data analysis)'s namesake SAS has been the preferred tool of scholars and corporate managers. But the R Project has also quickly found a following because statisticians, engineers and scientists without computer programming skills find it easy to use.
Reference:
http://www.nytimes.com/2009/08/06/technology/06stats.html
http://www.nytimes.com/2009/01/07/technology/business-computing/07program.html?pagewanted=all

So "Statistical Data Analysis" in the abstract sense is a formidable journey of a thousand miles, but the bite-size journey's first step involves importing a set of data into the tool (I'm assuming you already obtained, installed, and are running the software). For purposes of demonstration, I've created a data set using the actual previous year's receipts I had gathered and saved from each and every time I filled my car's tank with gasoline:
    18AUG2009  6 12.815 37.66
14JUL2009 12 4.340 11.8
28MAY2009 6 9.532 24.39
22APR2009 4 7.348 16.01
25MAR2009 2 5.509 11.12
15MAR2009 7 4.230 8.62
04MAR2009 3 11.989 25.16
21FEB2009 7 13.298 27.91
29JAN2009 15 13.989 27.68
03JAN2009 6 12.620 22.70
29NOV2008 16 11.239 20.78
25SEP2008 8 13.929 51.80
Note that on the tail end of the second line, in the last figure, 11.8, I omitted a zero ('0') when I was typing the data in. We'll come back to that later. I decided to record the following four fields for each time I filled the gas tank (all took place at Costco in San Leandro):
  1. date of purchase
  2. pump number
  3. quantity of gas obtained, in gallons
  4. cost of the transaction
In both tools, R and SAS, we will then divide cost by quantity and generate a fifth field, price per gallon.

To import a dataset into your software, you can either read from a file, or copy and paste it in (although for R, you will copy the data set, but you won't actually paste anything). The following scripts have been tested on R versions 2.8.1, 2.9.2 and SAS version 9.1.3 Service Pack 4.
  • To read data from a file within R and SAS:
    1. identify the path to the file containing your data set. Let's say the path is:
      G:\tpc247\petrol.txt
      if you're on Windows, the convention is to delimit or separate folders with a backslash, but this poses a problem for software that is trained to recognize tabs and carriage returns and newlines as '\t', '\r' and '\n' respectively. For reasons of cross-platform compatibility, if there are backslashes in your Windows path, add another one right next to it:
      G:\\tpc247\\petrol.txt
      or replace the backslash with a forward slash:
      G:/tpc247/petrol.txt
    2. at the command prompt, input and run the following incantations:
      • R:
        petrol_01 = read.table("G:/tpc247/petrol.txt", header=FALSE, col.names=c('date', 'pump', 'quantity', 'cost'))
        petrol_01$per_gallon <- petrol_01$cost / petrol_01$quantity
        petrol_01
      • SAS:
        data petrol_01;
        infile "G:/tpc247/petrol.txt";
        input date_of_sale$ 5-13 pump_number$ 16-17 quantity 20-25 cost 28-32;
        per_gallon = cost / quantity;
        proc print data=petrol_01;
        title 'Unleaded gasoline purchase history for 1 year, San Leandro, California Costco';
        run;
  • To read data from computer memory in R and SAS:
    • R:
      1. copy and paste this into R, but don't actually run the incantation yet:
        petrol_01 = read.table("clipboard", col.names=c('date', 'pump', 'quantity', 'cost'))
      2. copy your data set, then run the previous incantation

      3. run the rest as you normally would:
        petrol_01$price_per_gallon <- petrol_01$cost / petrol_01$quantity
        petrol_01
    • SAS:
      data petrol_01;
      input date_of_sale$ 5-13 pump_number$ 15-16 quantity 18-23 cost 25-29;
      per_gallon = cost / quantity;
      datalines;
      18AUG2009 6 12.815 37.66
      14JUL2009 12 4.340 11.8
      28MAY2009 6 9.532 24.39
      22APR2009 4 7.348 16.01
      25MAR2009 2 5.509 11.12
      15MAR2009 7 4.230 8.62
      04MAR2009 3 11.989 25.16
      21FEB2009 7 13.298 27.91
      29JAN2009 15 13.989 27.68
      03JAN2009 6 12.620 22.70
      29NOV2008 16 11.239 20.78
      25SEP2008 8 13.929 51.80
      proc print data=petrol_01;
      title 'Unleaded gasoline purchase history for 1 year, Costco in San Leandro, California';
      run;
Coming back to the omitted zero ('0') on the second line in our last figure, 11.8, you might find it amusing how finicky R and SAS are about what they eat. Putting this tutorial together gave me the opportunity to learn some valuable things about the two tools. Just like a toddler can be very picky about the food she feels like taking in her, feeding data to R and SAS and ensuring they digest the data correctly may require some forethought and planning. When importing the dataset into both tools from a file, I noticed that in:
  • R, if I didn't include in my incantation:
    header = FALSE
    I would find the first record in my dataset on file would be missing from my dataset in R
  • SAS, omitting the zero ('0') when I typed the following into my dataset, for July 14, 2009:
    14JUL2009 12  4.340 11.8
    did not pose a problem, as long as I ran a previous incarnation of my SAS script:
    data petrol_01;
    infile "G:/tpc247/petrol.txt";
    input date_of_sale$ pump_number$ quantity cost;
    per_gallon = cost / quantity;
    proc print data=petrol_01;
    run;
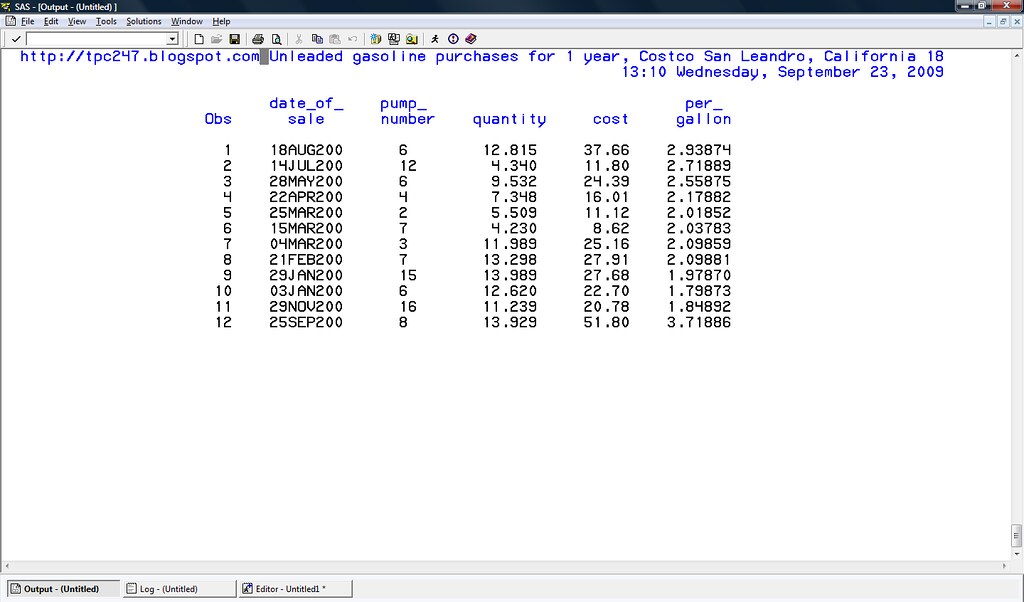
    However, I didn't like the resulting output in SAS. I have developed a preference for a specific way of representing dates that is 9 characters long and in a format that, to my eyes, is more easy to read. However, when I ran the aforementioned script on my data set, my dates were truncated:
    SAS fill gas tank dataset
    It seemed that SAS preferred data in columns to be 8 characters or less, or else it would truncate any value greater than 8 characters. So even though running my SAS script resulted in SAS correctly reading in my data, and there was no problem with my omitting the zero ('0'), I decided to modify the incantations in my script and specify the columns so that the dates in my desired format would not be cut off. When I did this, I noticed that data in SAS was different from the data on file:
    SAS fill gas tank dataset
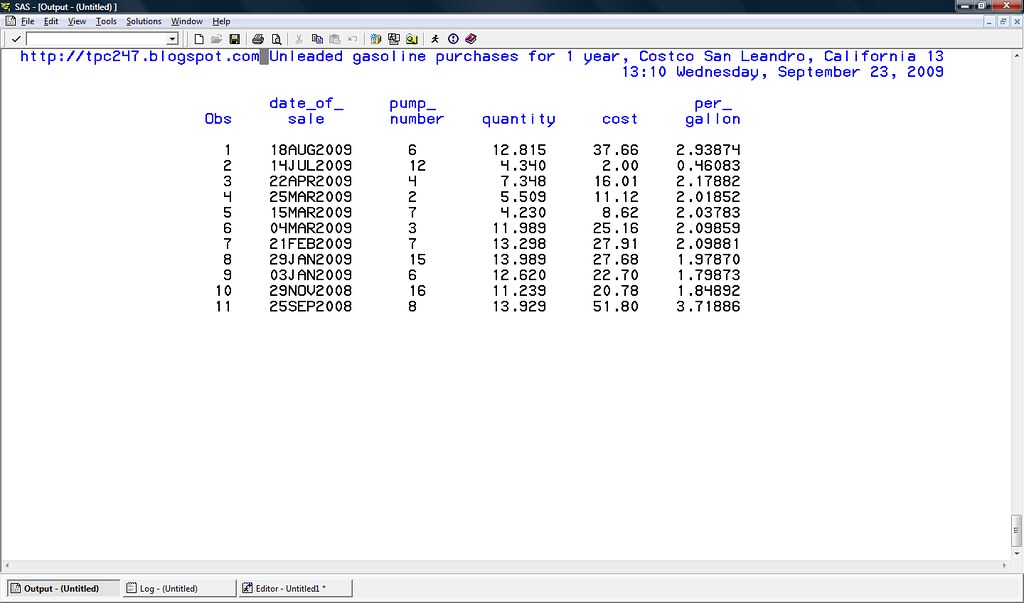
    As you can see, the information from the fill_the_gas_tank event for 28MAY2009 has disappeared, and the line in my dataset on file:
    14JUL2009 12  4.340 11.8
    has been replaced in SAS with
    14JUL2009 12  4.340 2.00 0.46083
    I imagine SAS would read 11.8 and then be confused because there were no more numbers and I had told it to expect one more, but I can't explain how SAS computed a cost of 2.00. However, I can explain that the price_per_gallon of around 46 cents is simply derived from dividing 2.00 dollars by 4.34 gallons. The fact that the record for May 28, 2009 is missing leads me to conclude that when reading data from file, and your SAS statement specifies columns, SAS seems to expect values for the entire range of columns you specify. I've confirmed this phenomenon, of a missing record when you specify in your SAS statement the columns where values can be found, manifests itself in SAS only when reading data from file, and not from the copy and paste of data.
Other separators and delimiters

If you have commas separating your data:
    18AUG2009,  6, 12.815, 37.66
14JUL2009, 12, 4.340, 11.8
28MAY2009, 6, 9.532, 24.39
22APR2009, 4, 7.348, 16.01
25MAR2009, 2, 5.509, 11.12
15MAR2009, 7, 4.230, 8.62
04MAR2009, 3, 11.989, 25.16
21FEB2009, 7, 13.298, 27.91
29JAN2009, 15, 13.989, 27.68
03JAN2009, 6, 12.620, 22.70
29NOV2008, 16, 11.239, 20.78
25SEP2008, 8, 13.929, 51.80
In:When importing data into R or SAS, you need to look at your dataset, and tell R or SAS exactly what to expect, or your statistical data analysis software may complain.

Reference: http://www.stat.psu.edu/online/program/stat481/01importingI/02importingI_styles.html