In field after field, computing and the Web are creating new realms of data to explore - sensor signals, surveillance tapes, social network chatter, public records and more. We're rapidly entering a world where everything can be monitored and measured, but the big problem is going to be the ability of humans to use, analyze and make sense of the data. Strong correlations of data do not necessarily prove a cause-and-effect link. For example, in the late 1940s, before there was a polio vaccine, public health experts in America noted that polio cases increased in step with the consumption of ice cream and soft drinks. Eliminating such treats was even recommended as part of an anti-polio diet. It turned out that polio outbreaks were most common in the hot months of summer, when people naturally ate more ice cream, showing only an association. Computers do what they are good at, which is trawling these massive data sets for something that is mathematically odd, and humans do what they are good at and explain these anomalies.To analyze statistical data, we use computer programs as tools to work with such information as biological data. Yet another recent article in the New York Times compares and contrasts two of these computer programs, R and SAS (and again I paraphrase):
SAS Institute (the privately held business software company that specializes in data analysis)'s namesake SAS has been the preferred tool of scholars and corporate managers. But the R Project has also quickly found a following because statisticians, engineers and scientists without computer programming skills find it easy to use.Reference:
http://www.nytimes.com/2009/08/06/technology/06stats.html
http://www.nytimes.com/2009/01/07/technology/business-computing/07program.html?pagewanted=all
So "Statistical Data Analysis" in the abstract sense is a formidable journey of a thousand miles, but the bite-size journey's first step involves importing a set of data into the tool (I'm assuming you already obtained, installed, and are running the software). For purposes of demonstration, I've created a data set using the actual previous year's receipts I had gathered and saved from each and every time I filled my car's tank with gasoline:
18AUG2009 6 12.815 37.66Note that on the tail end of the second line, in the last figure, 11.8, I omitted a zero ('0') when I was typing the data in. We'll come back to that later. I decided to record the following four fields for each time I filled the gas tank (all took place at Costco in San Leandro):
14JUL2009 12 4.340 11.8
28MAY2009 6 9.532 24.39
22APR2009 4 7.348 16.01
25MAR2009 2 5.509 11.12
15MAR2009 7 4.230 8.62
04MAR2009 3 11.989 25.16
21FEB2009 7 13.298 27.91
29JAN2009 15 13.989 27.68
03JAN2009 6 12.620 22.70
29NOV2008 16 11.239 20.78
25SEP2008 8 13.929 51.80
- date of purchase
- pump number
- quantity of gas obtained, in gallons
- cost of the transaction
To import a dataset into your software, you can either read from a file, or copy and paste it in (although for R, you will copy the data set, but you won't actually paste anything). The following scripts have been tested on R versions 2.8.1, 2.9.2 and SAS version 9.1.3 Service Pack 4.
- To read data from a file within R and SAS:
- identify the path to the file containing your data set. Let's say the path is:
G:\tpc247\petrol.txt
if you're on Windows, the convention is to delimit or separate folders with a backslash, but this poses a problem for software that is trained to recognize tabs and carriage returns and newlines as '\t', '\r' and '\n' respectively. For reasons of cross-platform compatibility, if there are backslashes in your Windows path, add another one right next to it:G:\\tpc247\\petrol.txt
or replace the backslash with a forward slash:G:/tpc247/petrol.txt
- at the command prompt, input and run the following incantations:
- R:
petrol_01 = read.table("G:/tpc247/petrol.txt", header=FALSE, col.names=c('date', 'pump', 'quantity', 'cost'))
petrol_01$per_gallon <- petrol_01$cost / petrol_01$quantity
petrol_01 - SAS:
data petrol_01;
infile "G:/tpc247/petrol.txt";
input date_of_sale$ 5-13 pump_number$ 16-17 quantity 20-25 cost 28-32;
per_gallon = cost / quantity;
proc print data=petrol_01;
title 'Unleaded gasoline purchase history for 1 year, San Leandro, California Costco';
run;
- R:
- identify the path to the file containing your data set. Let's say the path is:
- To read data from computer memory in R and SAS:
- R:
- copy and paste this into R, but don't actually run the incantation yet:
petrol_01 = read.table("clipboard", col.names=c('date', 'pump', 'quantity', 'cost')) - copy your data set, then run the previous incantation
- run the rest as you normally would:
petrol_01$price_per_gallon <- petrol_01$cost / petrol_01$quantity
petrol_01
- copy and paste this into R, but don't actually run the incantation yet:
- SAS:
data petrol_01;
input date_of_sale$ 5-13 pump_number$ 15-16 quantity 18-23 cost 25-29;
per_gallon = cost / quantity;
datalines;
    18AUG2009  6 12.815 37.66
    14JUL2009 12  4.340 11.8
    28MAY2009  6  9.532 24.39
    22APR2009  4  7.348 16.01
    25MAR2009  2  5.509 11.12
    15MAR2009  7  4.230  8.62
    04MAR2009  3 11.989 25.16
    21FEB2009  7 13.298 27.91
    29JAN2009 15 13.989 27.68
    03JAN2009  6 12.620 22.70
    29NOV2008 16 11.239 20.78
    25SEP2008  8 13.929 51.80
proc print data=petrol_01;
title 'Unleaded gasoline purchase history for 1 year, Costco in San Leandro, California';
run;
- R:
- R, if I didn't include in my incantation:
header = FALSE
I would find the first record in my dataset on file would be missing from my dataset in R - SAS, omitting the zero ('0') when I typed the following into my dataset, for July 14, 2009:
14JUL2009 12 4.340 11.8
did not pose a problem, as long as I ran a previous incarnation of my SAS script:data petrol_01;
However, I didn't like the resulting output in SAS. I have developed a preference for a specific way of representing dates that is 9 characters long and in a format that, to my eyes, is more easy to read. However, when I ran the aforementioned script on my data set, my dates were truncated:
infile "G:/tpc247/petrol.txt";
input date_of_sale$ pump_number$ quantity cost;
per_gallon = cost / quantity;
proc print data=petrol_01;
run;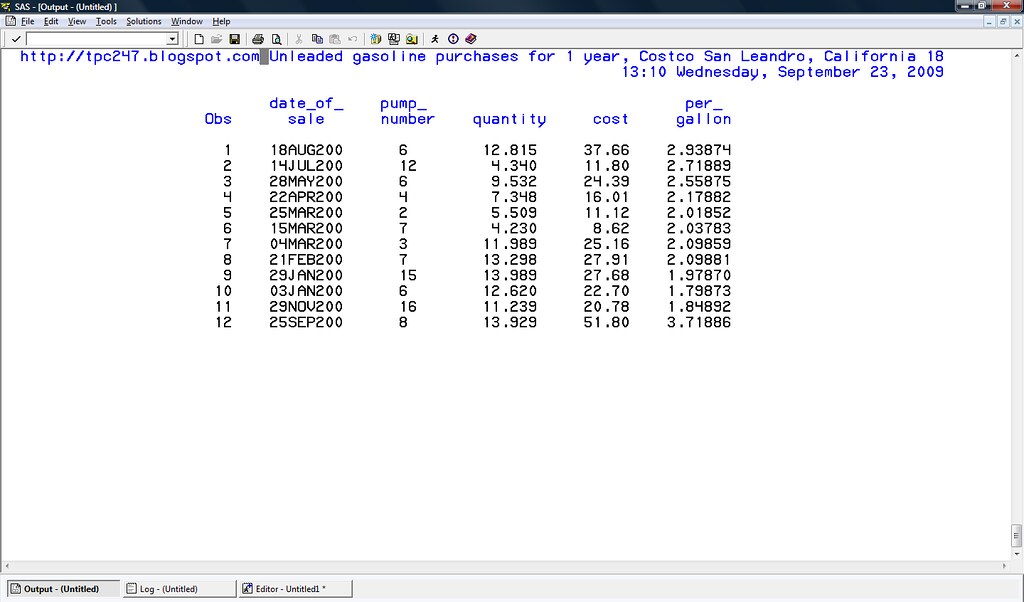
It seemed that SAS preferred data in columns to be 8 characters or less, or else it would truncate any value greater than 8 characters. So even though running my SAS script resulted in SAS correctly reading in my data, and there was no problem with my omitting the zero ('0'), I decided to modify the incantations in my script and specify the columns so that the dates in my desired format would not be cut off. When I did this, I noticed that data in SAS was different from the data on file: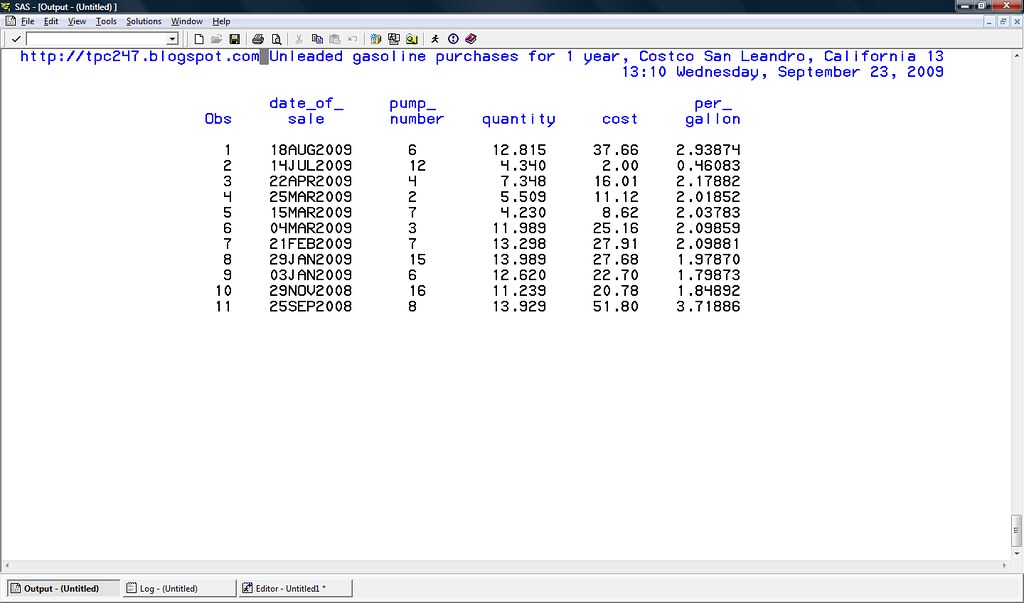
As you can see, the information from the fill_the_gas_tank event for 28MAY2009 has disappeared, and the line in my dataset on file:14JUL2009 12 4.340 11.8
has been replaced in SAS with14JUL2009 12 4.340 2.00 0.46083
I imagine SAS would read 11.8 and then be confused because there were no more numbers and I had told it to expect one more, but I can't explain how SAS computed a cost of 2.00. However, I can explain that the price_per_gallon of around 46 cents is simply derived from dividing 2.00 dollars by 4.34 gallons. The fact that the record for May 28, 2009 is missing leads me to conclude that when reading data from file, and your SAS statement specifies columns, SAS seems to expect values for the entire range of columns you specify. I've confirmed this phenomenon, of a missing record when you specify in your SAS statement the columns where values can be found, manifests itself in SAS only when reading data from file, and not from the copy and paste of data.
If you have commas separating your data:
18AUG2009, 6, 12.815, 37.66In:
14JUL2009, 12, 4.340, 11.8
28MAY2009, 6, 9.532, 24.39
22APR2009, 4, 7.348, 16.01
25MAR2009, 2, 5.509, 11.12
15MAR2009, 7, 4.230, 8.62
04MAR2009, 3, 11.989, 25.16
21FEB2009, 7, 13.298, 27.91
29JAN2009, 15, 13.989, 27.68
03JAN2009, 6, 12.620, 22.70
29NOV2008, 16, 11.239, 20.78
25SEP2008, 8, 13.929, 51.80
- R: replace read.table() with read.csv()
Reference: http://pbil.univ-lyon1.fr/library/base/html/read.table.htm - SAS: simply update the existing column information to reflect the new column values, or, modify your script to specify the column range for where the values can be
Reference: http://www.stat.psu.edu/online/program/stat481/01importingI/02importingI_styles.html